Petrochemical Margin Analyzer
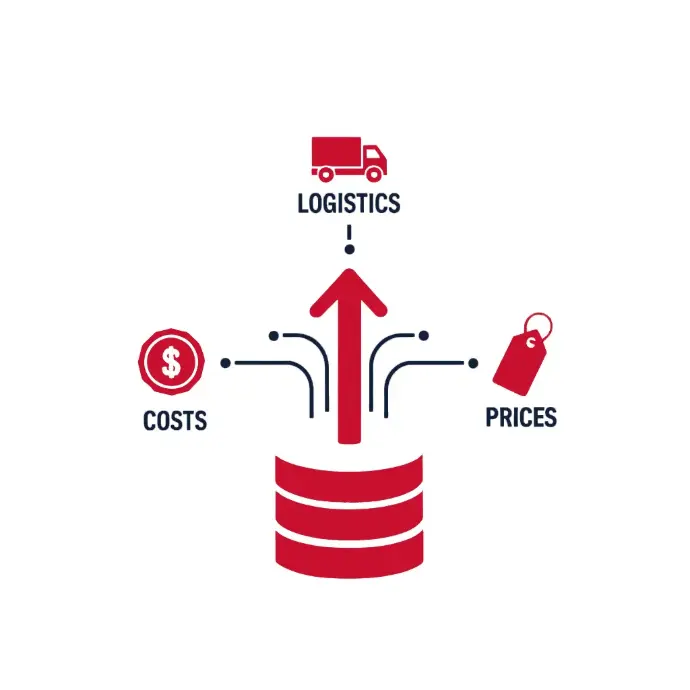
Calculates real-time production margins considering variable costs (feedstocks, logistics, market prices). Connects with platforms like Bloomberg Terminal for accurate, updated data, supporting optimal financial decisions.
Benefits
Margin
Protects profitability by incorporating key variables like feedstocks, logistics, and prices. Provides continuously updated margins for quick reaction to market changes.
Integration
Combines financial and operational data for a holistic margin analysis. Synchronizes internal costs with external market prices for consistent, reliable data.
Decisions
Delivers clear, actionable insights for quick adjustments to production or pricing. Provides quantifiable evidence to support tactical and strategic decisions.
Reporting
Automates the creation of periodic and ad-hoc reports for finance leaders. Reduces manual effort and speeds up review and control cycles.
How It Works
Data capture
Gathers real-time production costs, logistics expenses, and market prices from various sources, ensuring data quality and traceability.

Margin computation
Calculates profitability in seconds by integrating direct and indirect variables and applying business rules and specific adjustments for each plant or product.
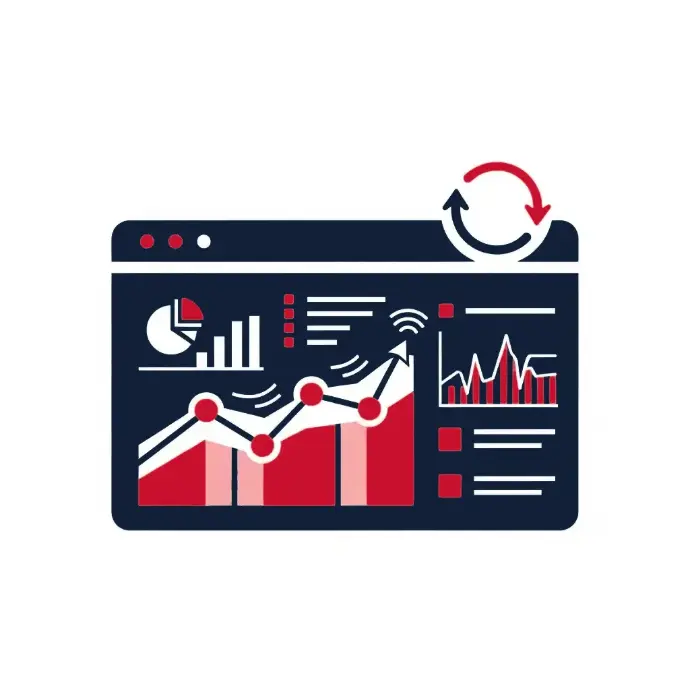
Financial dashboards
Refreshes dashboards with KPIs, trends, and benchmarks, supporting detailed analysis by plant or period and aligning finance, trading, and operations teams.

Alerts & scenarios
Triggers alerts for significant margin deviations and allows users to simulate price or cost adjustments to refine models and improve future accuracy.
Use Cases
Daily margin monitoring: Tracks production profitability each day to enable operational adjustments. Provides current and reliable data to reduce exposure to adverse moves. Supports quick tactical changes to protect margins.
Feedstock impact analysis: Measures how raw material price swings affect product margins. Helps prioritize sourcing alternatives or mix adjustments to mitigate cost shocks. Supports supplier negotiations with quantified scenarios.
Executive reporting: Produces periodic financial reports for leadership with key metrics and trend analysis. Automates distribution to internal and external stakeholders. Speeds up strategic decisions with verified, timely information.
Optimization simulations: Allows testing of cost, price, and production scenarios in a sandbox environment. Assesses outcomes before implementation to lower operational risk. Supports short- and mid-term financial and operational planning.
Integration and Customization
Financial Data Platforms
Provides up-to-date market price and cost information for accurate analysis.
Financial ERP
Imports and synchronizes internal cost and expense data for comprehensive review.
Analytics Dashboards
Dynamic visualization of margins and trends for informed decision-making.
Notification System
Sends alerts for significant fluctuations in key metrics.